지난번에 올린 LSTM 기반 AMZN, GOOGL 에 Backtesting을 적용해 보고자 했다.
우선 backtesting이 뭔지부터 알아보자
Backtesting
투자에 있어 모델이나 전략을 수립하고, 이것이 fit하는지 확인하기 위해 과거 데이터에 대입해 봄. 원하는 수준의 metric을 얻으면 모델/전략을 잘 수립한 것!

과거 가격을 이용해 투자 전략을 시뮬레이션해서 결과와 위험 분석하는것이다.
그렇다면 backtesting library를 실습해 보자
import yfinance as yf
import ta
import pandas as pd
from backtesting import Backtest, Strategy
from backtesting.lib import crossover
필요한 라이브러리 import
class SMAcross(Strategy):

  n1 = 50
  n2 = 100

  def init(self):
    close = self.data.Close
    self.sma1 = self.I(ta.trend.sma_indicator, pd.Series(close), self.n1)
    self.sma2 = self.I(ta.trend.sma_indicator, pd.Series(close), self.n2)

  def next(self):
    if crossover(self.sma1, self.sma2):
      self.buy()
    elif crossover(self.sma2, self.sma1):
      self.sell()
SMAcross class
SMA : Simple Moving Average
이동평균선 두 개의 교차지점을 통한 매매를 관리하는 class이다.
단기 이동평균선(sma1)이 장기 이동평균선(sma2)를 교차해 지나가면 매수(골든크로스)
장기 이동평균선(sma2)이 단기 이동평균선(sma1)을 교차해 지나가면 매도(데드크로스)
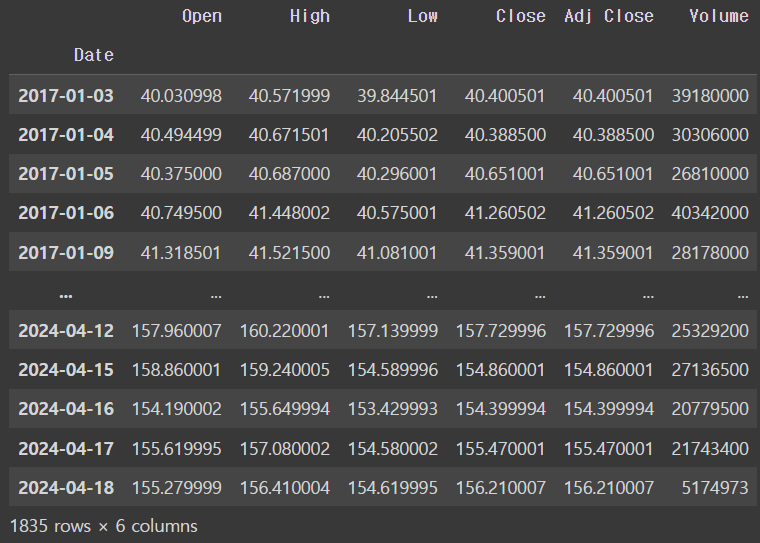
df = yf.download('GOOGL', start='2017-01-01')Google의 2017년 1월1일부터의 데이터를 yahoo finance에서 다운로드한다
bt = Backtest(df, SMAcross, cash=10000, commission=0.002, exclusive_orders=True)Backtest 초기화
cash : backtest시작할 초기 현금 금액
commission : backtest동안 이루어질 거래에 대한 수수료
exclusive_orders : 새 주문 이전에 이전 거래 청산
output = bt.run()
output
---------------------------------------------
Start                     2017-01-03 00:00:00
End                       2024-04-18 00:00:00
Duration                   2662 days 00:00:00
Exposure Time [%]                   90.681199
Equity Final [$]                 20130.728772
Equity Peak [$]                  20663.499402
Return [%]                         101.307288
Buy & Hold Return [%]              286.653635
Return (Ann.) [%]                   10.085199
Volatility (Ann.) [%]               32.019226
Sharpe Ratio                         0.314973
Sortino Ratio                        0.492152
Calmar Ratio                         0.170039
Max. Drawdown [%]                  -59.311133
Avg. Drawdown [%]                   -5.600059
Max. Drawdown Duration     1574 days 00:00:00
Avg. Drawdown Duration       63 days 00:00:00
# Trades                                   16
Win Rate [%]                             37.5
Best Trade [%]                       92.72425
Worst Trade [%]                    -23.867845
Avg. Trade [%]                       4.504201
Max. Trade Duration         595 days 00:00:00
Avg. Trade Duration         151 days 00:00:00
Profit Factor                        2.599179
Expectancy [%]                       7.232814
SQN                                  1.200652
_strategy                            SMAcross
_equity_curve                             ...
_trades                       Size  EntryB...
dtype: object
backtesting 결과

backtesting 결과를 차트로 출력할 수도 있다.
그런데 output metric에서, 만약 Win Rate [%]을 중점으로 최적화를 수행하고 싶을 수도 있다. 개개인마다 비중을 두는 항목이 다를 수 있다. 이때, 최적화를 수행한다.
optim = bt.optimize(n1 = range(50,160,10),
                    n2 = range(50,160,10),
                    constraint = lambda x: x.n2 - x.n1 > 20,
                    maximize = 'Win Rate [%]')

bt.plot()
n1, n2 sma를 50일에서 160일 이동평균 사이로 적절한 값을 찾는데, 이때의 stride는 10이다.
constraint : n2와 n1의 차이는 최소 20이어야한다.

optimized plot.
이전 그림에선 n1, n2가 각각 50, 100이었던 것에 반해 이번엔 80, 130으로 바뀌었다.
optim

---------------------------------------------
Start                     2017-01-03 00:00:00
End                       2024-04-18 00:00:00
Duration                   2662 days 00:00:00
Exposure Time [%]                   88.773842
Equity Final [$]                 16067.747907
Equity Peak [$]                   16493.13841
Return [%]                          60.677479
Buy & Hold Return [%]              286.653635
Return (Ann.) [%]                    6.729319
Volatility (Ann.) [%]               29.400248
Sharpe Ratio                         0.228886
Sortino Ratio                        0.353613
Calmar Ratio                         0.116098
Max. Drawdown [%]                  -57.962271
Avg. Drawdown [%]                   -5.329549
Max. Drawdown Duration     1699 days 00:00:00
Avg. Drawdown Duration       78 days 00:00:00
# Trades                                   12
Win Rate [%]                        58.333333
Best Trade [%]                      72.730507
Worst Trade [%]                    -19.164579
Avg. Trade [%]                       4.045019
Max. Trade Duration         588 days 00:00:00
Avg. Trade Duration         198 days 00:00:00
Profit Factor                        2.137567
Expectancy [%]                        7.02783
SQN                                  0.818468
_strategy                 SMAcross(n1=80,n...
_equity_curve                             ...
_trades                       Size  EntryB...
dtype: object
Win Rate [%] 항목이 37.5%에서 58.333333%로 상승한 것을 볼 수 있다.
Backtesting library는 어떻게 사용하는지 익혔는데, LSTM으로 예측한 코드에는 어떻게 얹어야하는지 모르겠다.. 일단 공부한 데까지라도 작성!
reference
https://www.investopedia.com/terms/b/backtesting.asp
'공부기록' 카테고리의 다른 글
| [Stock Forecasting]BackTesting in LSTM Stock Forecasting (공부기록 10일차, 240421) (2) | 2024.04.22 |
|---|
